Configure PostgreSQL Data Sources with Prometheus Setup on Windows Server
Database monitoring is a cornerstone of maintaining high-performing and reliable systems. For PostgreSQL databases, combining Prometheus with Postgres Exporter creates a powerful monitoring solution. This guide provides detailed instructions on setting up PostgreSQL as a data source in Prometheus on a Windows server, with configurations using auth_modules or Windows environment variables. The goal is to ensure you can efficiently collect, visualize, and act on critical database metrics.
Why Monitor PostgreSQL Databases with Prometheus?
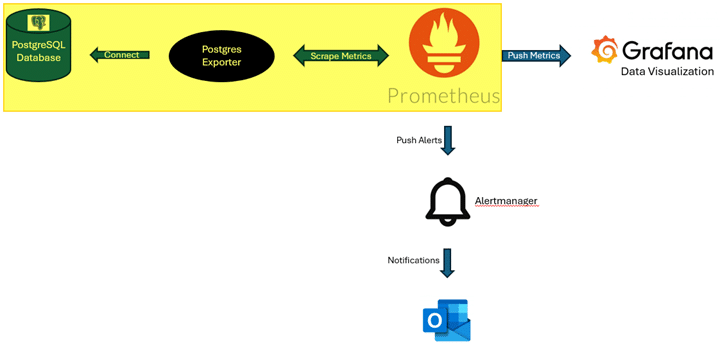
Effective database monitoring helps teams proactively address performance bottlenecks, detect anomalies, and ensure system reliability. Prometheus is a popular, open-source monitoring tool designed for time-series data, making it an excellent choice for database metrics. When paired with Postgres Exporter, Prometheus can collect detailed metrics about PostgreSQL databases, including query performance, connections, and resource usage.
Using Prometheus to monitor PostgreSQL databases provides several benefits:
- Comprehensive Metrics: Metrics such as transaction rates, replication lag, and query performance are readily available.
- Real-Time Visualization: Integration with Grafana enables dynamic dashboards for real-time monitoring and analysis.
- Proactive Alerts: Use Alertmanager to configure notifications for key database events, such as high CPU usage or connection spikes, ensuring you respond promptly to issues.
- Scalability: Prometheus can handle multiple PostgreSQL instances, making it suitable for large-scale deployments.

Setting Up PostgreSQL Data Sources in Prometheus
To monitor PostgreSQL databases, you need to configure Postgres Exporter to collect metrics from your PostgreSQL instances. Postgres Exporter acts as a bridge, exposing metrics that Prometheus can scrape. Let’s dive into the setup process.
Step 1: Prerequisites
Before configuring Prometheus, ensure the following prerequisites are met:
- Prometheus is Installed
- Download and install Prometheus from the official site.
- Ensure it runs correctly on your Windows server.
- Postgres Exporter is Installed
- Install Postgres Exporter, the tool that collects metrics from your PostgreSQL databases and makes them accessible to Prometheus.
- Database Access Role
- Ensure you have a PostgreSQL user account with either the pg_monitor or pg_read_all_stats role. These roles allow access to the metrics required by Postgres Exporter.
Step 2: Configure Prometheus to Scrape PostgreSQL Metrics
The heart of this setup is connecting Prometheus to your PostgreSQL database via Postgres Exporter. Prometheus uses a configuration file (prometheus.yml) to define its scrape jobs. Below are two methods for establishing this connection:
Option 1 (Preferred): Using auth_modules in Postgres Exporter
The auth_modules approach is recommended for setups that involve monitoring multiple PostgreSQL instances. This method centralizes authentication details, ensuring scalability and simplicity in managing multiple targets.
Here’s how to configure Prometheus and Postgres Exporter:
Scrape configs section example in prometheus.yml file:
– job_name: ‘dev-database’
static_configs:
– targets:
– hostname.com:5432/postgres
metrics_path: “/probe”
params:
auth_module:
– devCreds
relabel_configs:
– source_labels: [__address__]
target_label: __param_target
– source_labels: [__param_target]
target_label: instance
– target_label: __address__
replacement: localhost:9187
Auth_modules block example in postgres_exporter.yml file:
auth_modules:
devCreds: # Set this to any name you want
type: userpass
userpass:
username: dev-database-username
password: dev-database-password
options:
# options become key=value parameters of the DSN
sslmode: disable
As long as the auth_module parameter matches, Postgres Exporter will be able to pull database metrics and feed into Prometheus.
Option 2: Use Windows environment variable to connect to Postgres Exporter
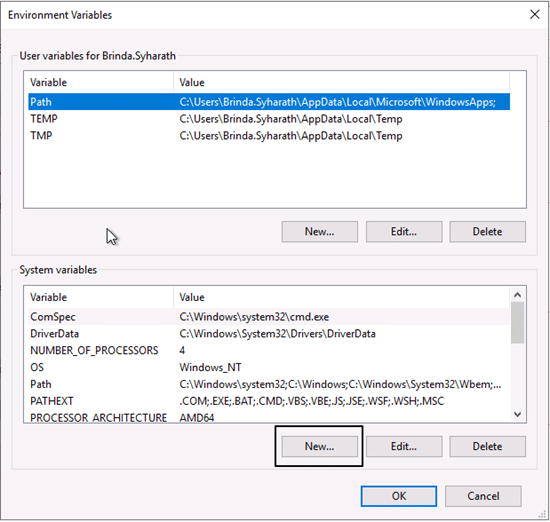
Go to Control Panel – System and Security – System – Advanced system settings – Environmental variables – Create new System variable –
Click “New” under System variables:

Create variable – DATA_SOURCE_NAME
Variable value = postgresql://<username>:<password>@<target_host>:5432/?sslmode=disable”
Click OK to add the variable
Click OK under the Environment Variables screen.
By default, Postgres Exporter will try to connect to the PostgreSQL database instance using the DATA_SOURCE_NAME variable without other configurations.
Step 3: Visualizing and Alerting
Once Prometheus is scraping metrics, you can leverage Grafana and Alertmanager to make the most of your monitoring setup.
1. Visualize Metrics in Grafana
- Install Grafana and connect it to Prometheus as a data source.
- Import PostgreSQL monitoring dashboards or create custom dashboards to display metrics such as query performance, connections, and replication health.
2. Configure Alerts with Alertmanager
- Define alert rules in the prometheus.yml file. For example, you can set up alerts for high query durations or connection limits.
- Use Alertmanager to push notifications via email, Slack, or other channels when an alert is triggered.
Best Practices for Monitoring PostgreSQL Databases
- Centralize Configurations: Use the auth_modules approach for managing multiple PostgreSQL targets efficiently.
- Optimize Metrics Collection: Avoid overloading Prometheus by limiting the scrape interval or filtering unnecessary metrics.
- Secure Connections: Use secure credentials and configure SSL to protect database connections.
- Regularly Update Dashboards: Keep Grafana dashboards up-to-date to reflect changes in your monitoring priorities.
Conclusion
Monitoring PostgreSQL databases with Prometheus and Postgres Exporter is a powerful way to ensure database reliability and performance. By following the steps outlined in this guide, you can easily collect, visualize, and act on database metrics.
- Preferred Method: Use auth_modules in Postgres Exporter for scalability and centralized management.
- Alternative Method: Use a Windows environment variable for quick and straightforward setups.
At Fortified Data, we understand the critical role of monitoring in maintaining database health. Whether you’re setting up a new monitoring solution or optimizing an existing one, our team is here to support you with industry-leading expertise and solutions.
Reach out to us today to learn more about how we can help you build a robust monitoring strategy tailored to your needs.


Leave a Reply
Want to join the discussion?Feel free to contribute!